The Arts Education Data Project is rooted in data reporting efforts dating back to the 1990’s. The year 2004 saw the first release of a statewide report using state department of education data. Today, the Arts Education Data Project is working in 31 states to increase arts participation and provide arts education data to empower citizens in all 50 states.
Brand Manager | Digital Content
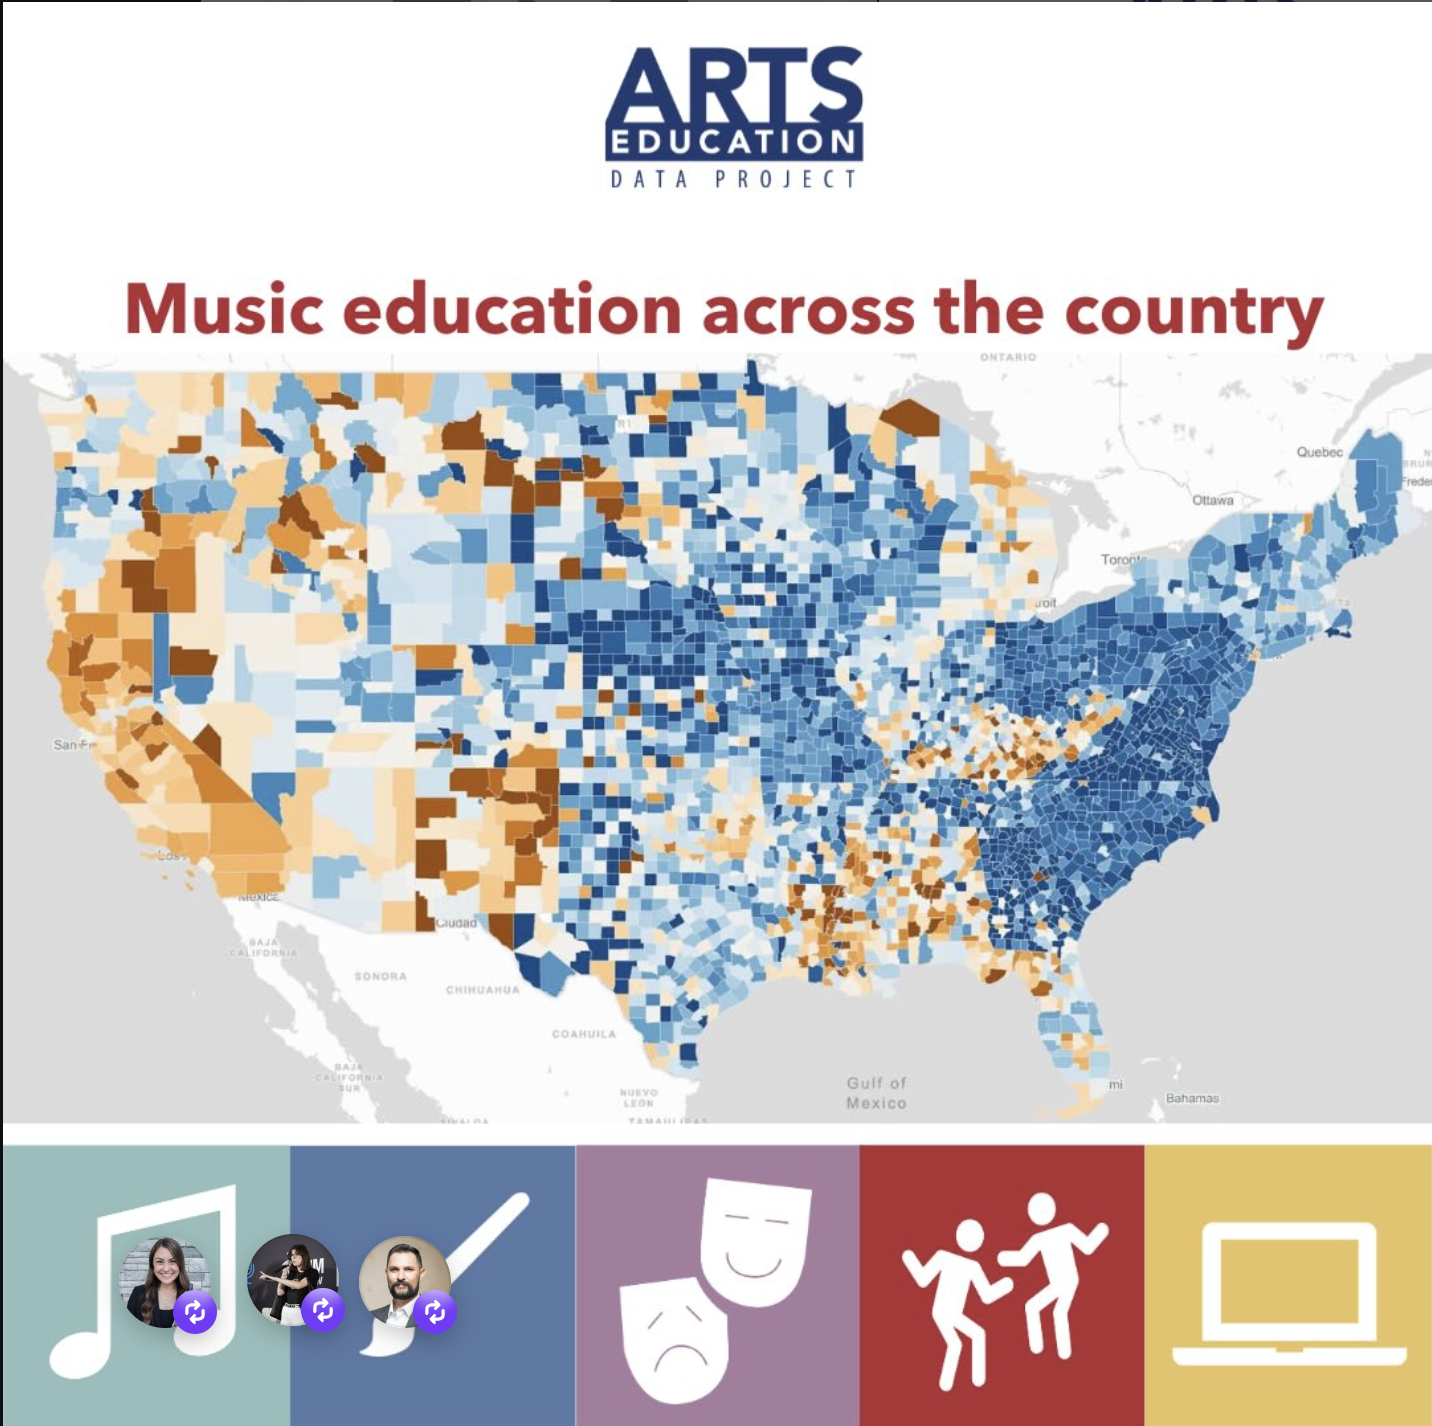
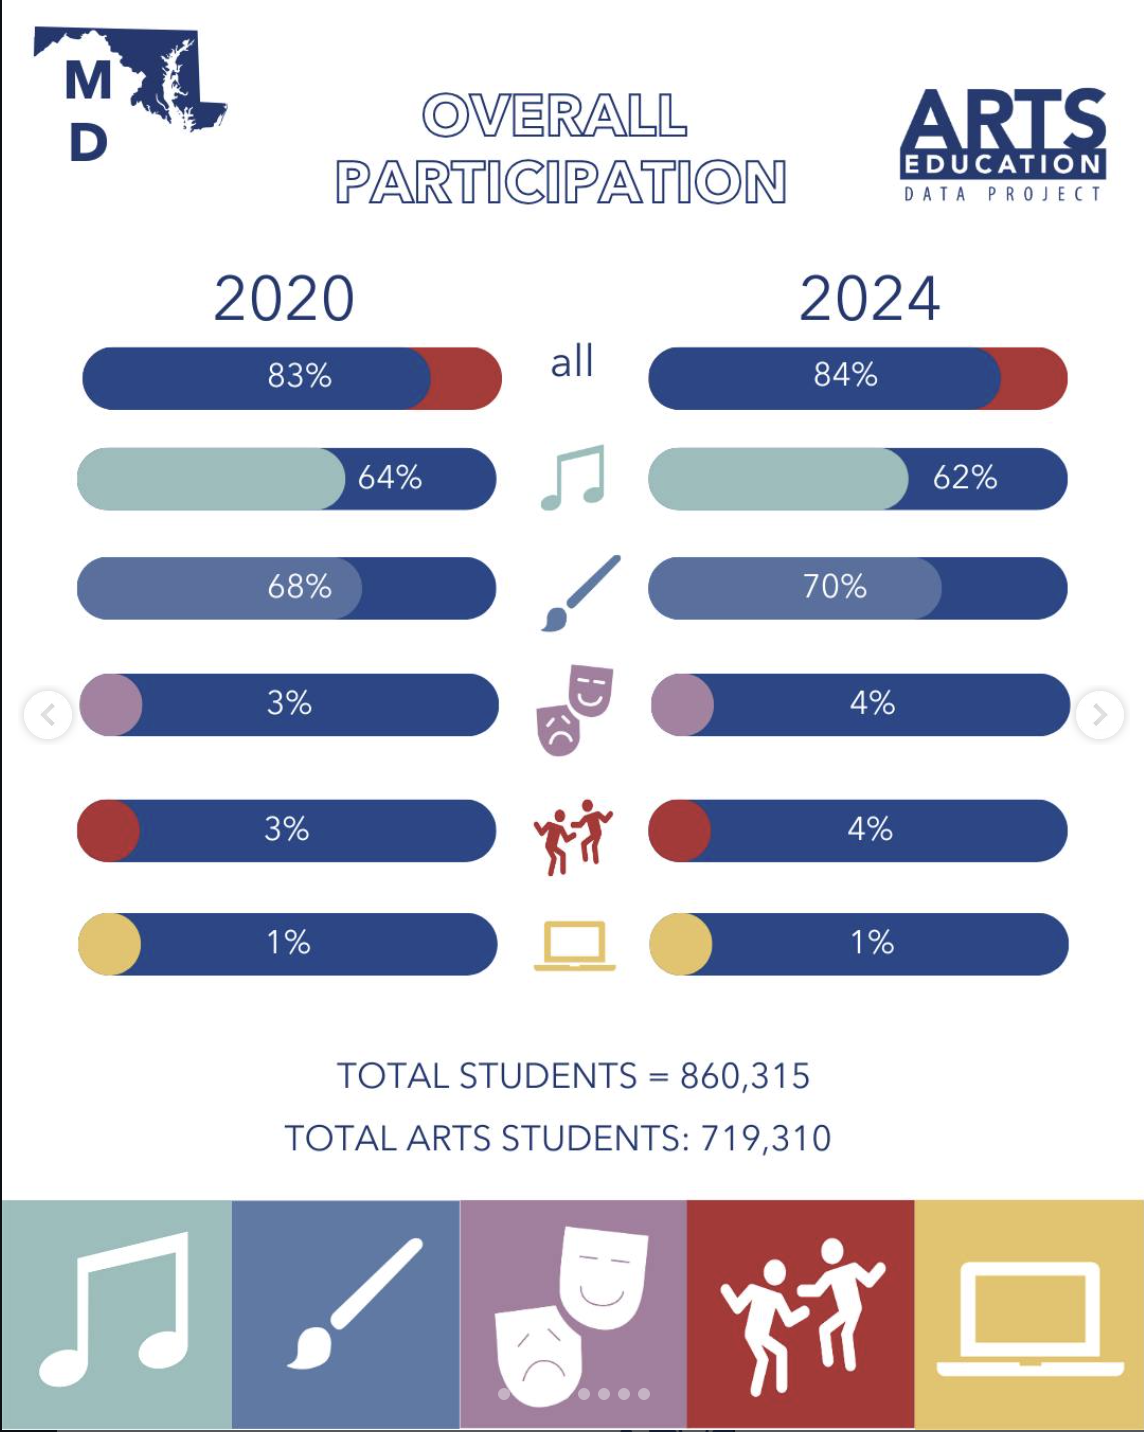
Since 2022, we have launched the Arts Education Data Project across Facebook, Instagram, LinkedIn, and Subtack. Finding ways to visualize data in an easy/digestible way.
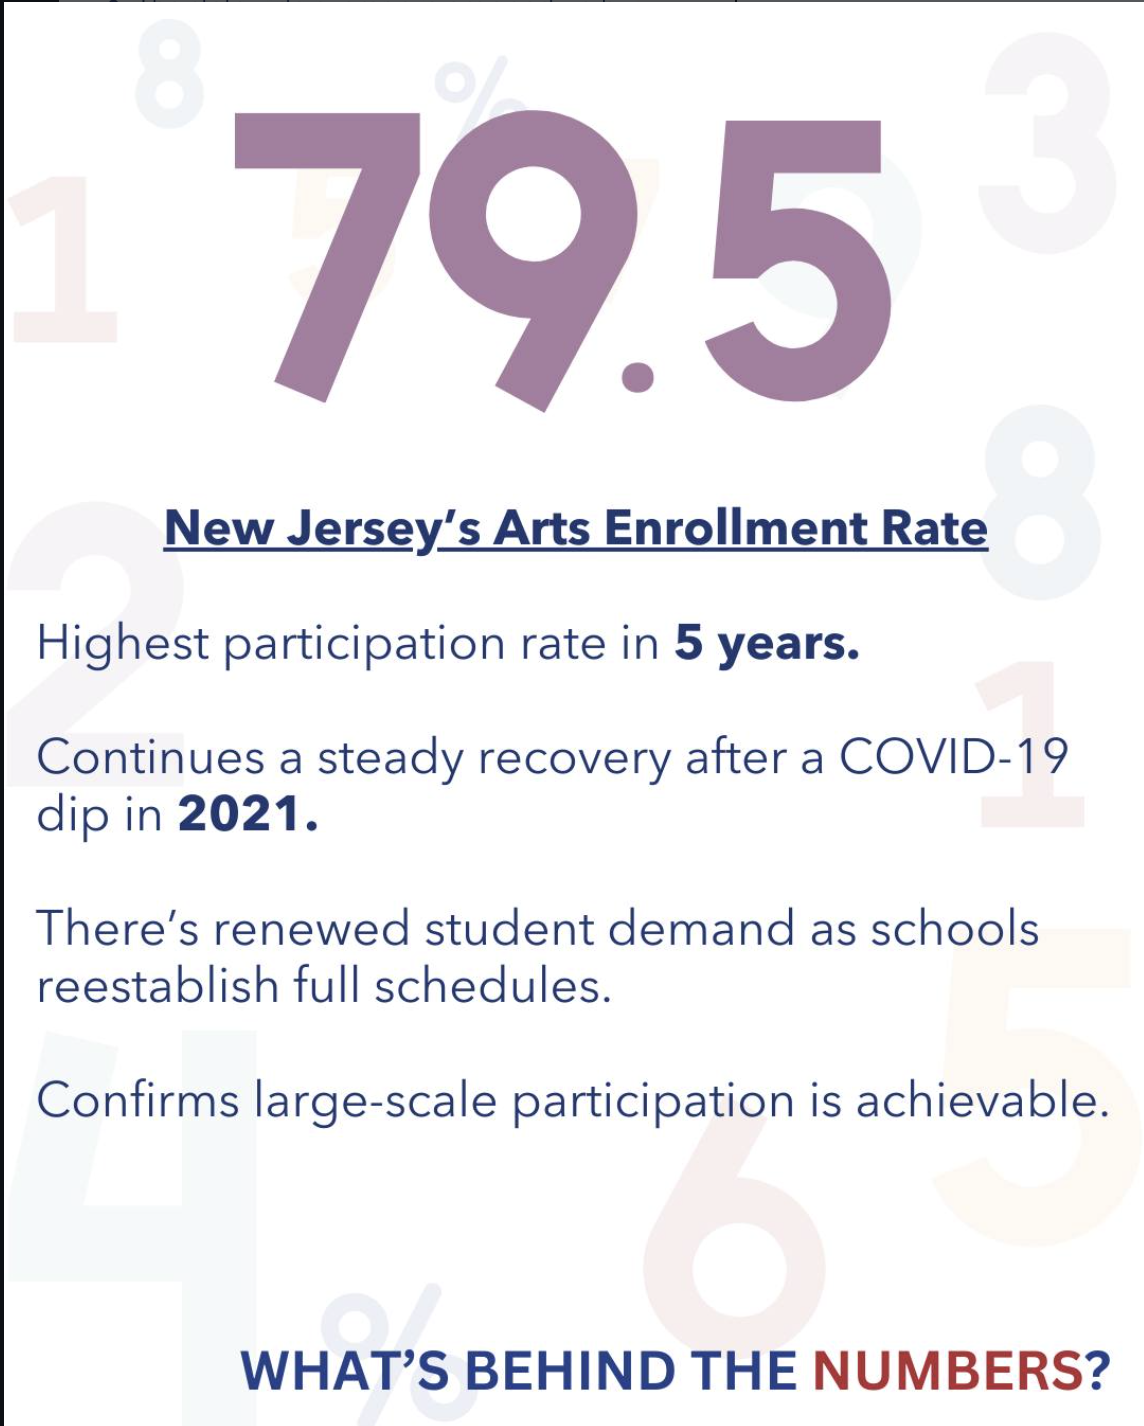
The Arts Ed Data Project launched “What’s Behind the Numbers” on Substack in 2026 as a method of telling the story behind some of these data points as a relatable tactic for educators and advocates to use in their programs.